
Data Portfolio
Duration
10 Week Course
Tools
Microsoft Excel, Tableau Desktop, Tableau Prep Builder,
Key Skills
Data Cleaning, Estimating, Visualization and Management
Team
Individual
Background Info
In the course on Data Management, Estimating and Visualization in Graphic Communication, I spent 10 weeks learning a wide variety of topics and skills in the realm of data. Using both Excel and Tableau Desktop, I developed the tools to first, clean a data set and then format it in a graphically pleasing way. I also learned methods on estimating and searching for data, which I found to be especially useful in a business setting.
Clean Mailing List
Summary
In the first lab, I started by taking a randomly generated list (in the form of csv) containing the personal information (first name, last name, phone number etc.) of 500 (fake) customers. I was then tasked with cleaning the data set, to break down each category into separate sheets. Next, I formatted the data set to remove extraneous data pieces.
Skills Learned
-
Name Manager used to record a list of extraneous values (honorifics) within name column
-
Filter and Sort Commands: used to identify extraneous values
-
Formulas used to search for and pull out the honorific within names, as well as to create a new field that subtracts the honorific from the name
-
Flash Fill Function used to fill a new column with a generated pattern, applied to transform phone numbers to this format ((xxx) xxx-xxxx)
-
Text to Columns Function used to separate fields by a certain value (comma, space, etc.)
-
Substitute command used to replace a certain string with another string
Link to Excel Files

Basic Paper Estimating
Summary
In the basic paper estimating lab, I created a basic paper estimating sheet. I used the name manager tool to create menus for certain input fields related to stock and stock prices. In calculated cells, I wrote formulas, some of which simply multiplied input cells while others incorporated IF statements.
Skills Learned
-
Name Manager: used to record lists for stock and stock price values
-
Data Validation used to create dropdown menus for certain cells
-
IF statements used to fill cells with a specific calculation that depends on the selected input of a different cell
-
Error Handling used to ensure calculated cells are executed properly and labeled correctly if an error does occur
Link to Excel Files

Stocks Data Visualization
Summary
In the stocks data lab, I used Tableau Desktop to clean and sort a data set on the value and volume of Apple, Microsoft, and Google stocks over time. To begin, I imported the csv data file into Tableau Desktop and analyzed the field types. From there, I created a plot that compared the value and volume of the stocks of the three companies over a 10 year period.
Skills Learned
-
Aggregate Date Fields by Year
-
Dual Axis Function used to create a line plot with both volume of stocks purchased as well as the price of each stock at a particular date in time.
-
Filter function used to filter the data set by the Range of dates
-
Understanding of the two types of pills: blue for discrete fields and green for continuous fields.
-
Formatting and styling (color, size, labels, tooltips, etc.) of plot in order to tell a story that is both compelling and graphically pleasing

GrC Graduates Data Cleaning
Summary
In the GrC graduates lab, I used Tableau Prep Builder to combine and clean a series of data sets related to Graphic Communication graduates. From the data, I created union tables based on similar fields. To clean the data, I removed various extraneous or repeated data fields. Next, I created pivot tables for the men and women columns and then combined them with a join table.
Skills Learned
-
Union tool used to group tables based on a similar rows
-
Add tool used to add tables to an already unionized group
-
Pivot tool used to convert numbers for data on both men and women into columns
-
Join tool used to combine pivot men and pivot women (based on matching year field)
-
Output tool used to export newly cleaned table in the form of a hyper file
-
Opened the output file in Tableau Desktop and created a bar chart comparing female to male GrC graduates over time

Budgeting and Ink Tables
Summary
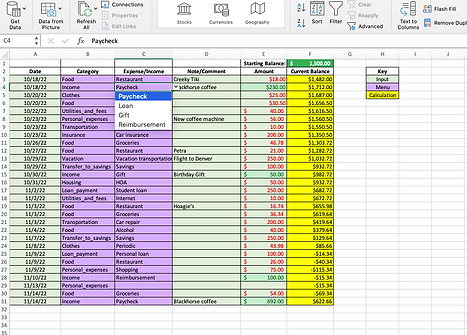
The Budgeting and Ink Mileage Lab involved using Excel to manage ongoing data sets related to 1) a monthly budget and 2) ink mileage. The first sheet is a formatted chart displaying a personal budget. The second chart is an ink mileage sheet that calculates ink mileage for certain colored inks based on an ink lookup chart.
Skills Learned
-
Name Manager used to record entire array of categories, including categories of income / expenses as well as paper and ink types
-
Name Manager also used to create table and lookup arrays for VLOOKUP calculations in mileage cells
-
Data Validation tool used to assign drop down menus to cells
-
Conditional formatting tool used to create a rule that will assign a specific format (green fill, green text) to an "amount" cell only when the cells corresponding expense / income cell reads "income"
-
IF statements used to add the value in the "expense/income" cell if the cell is "income" and subtract the value if the cell is not "income"
-
VLOOKUP formulas used to assign a specific value that comes from another table on another sheet
Link to Excel Files
Book Design Cost Estimating
Summary
This lab involved using excel to estimate various costs associated with the production of a book for The Cuesta Community College. To calculate costs, I wrote V and H lookups to locate costs from other tables. The chart includes cells with drop down menus, V and H lookups, user inputs, and calculations. Fields include item, type, and difficulty, as well as categories for different elements of the book production process.
Skills Learned
-
Name Manager used to record entire array of categories, including costs of the production process (cover, interior design, intellectual property rights, etc.)
-
Name Manager also used to create table and lookup arrays used for V and H LOOKUP calculations
-
Data Validation tool used to assign drop down menus to cells with menus
-
Conditional formatting tool used to create a rule that will assign a specific format (red fill, red text) to input cells incorrectly listed or left blank where its corresponding type or difficulty cell is filled
-
Error Handling used to ensure calculated cells are executed properly and labeled correctly if an error does occur
-
V and H LOOKUP formulas used to assign a specific value coming from other tables on another sheet
-
Simple calculations used to multiply inputs by Budgeted Hourly Rate (BHR) values and to add total costs
Link to Excel Files

San Diego Airbnb Visualizations
Summary
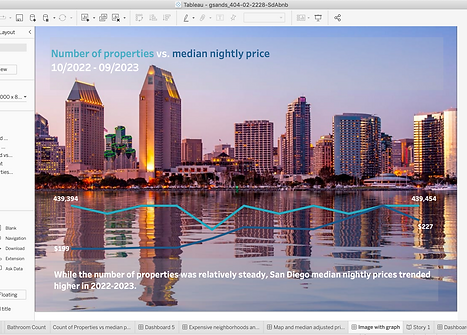
In the this lab, I used Tableau Desktop to create a number of plots to generate conclusions on the price and value of Airbnbs in the San Diego area from 2022-2023. Using an extensive data source on San Diego Airbnbs, I compared the prices, bathroom count, and location of airbnb.
Skills Learned
-
Aggregate Date Fields by Year
-
Dual Axis Function used to create a line plot with both volume of stocks purchased as well as the price of each stock at a particular date in time
-
Filter function used to filter the data set by week, bathroom count, and location to San Diego Zoo
-
Dashboards used to clearly and efficiently display and contextualize graphs and stories used to layout dashboards in a interesting and informative manner
-
Formatting and styling (color, size, labels, tooltips, etc.) of plots in order to tell a story about when and where in San Diego people like to travel
Pivot Tables for GrC 404 Students
Summary
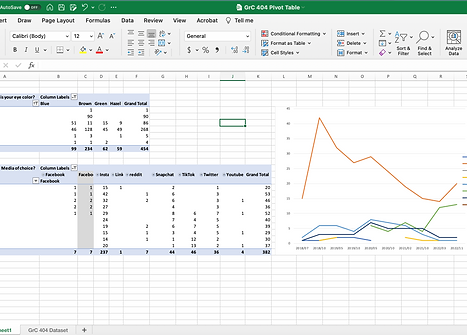
This lab involved using excel to organize a very large and ongoing data set using pivot tables. The dataset was pulled from a survey, containing questions on basic demographics and interests, that is regularly taken by GrC students when they take the class. In a separate sheet, I created multiple pivot tables that allowed me sort, filter and graph the data in order to create conclusions on student demographics and interests throughout the last decade.
Skills Learned
-
Pivot tables created and placed on a separate sheet and then used to filter and sort certain fields
-
Filter tool used to remove invalid, extraneous, or irrelevant values from row and column labels (ie: removing N/A or blank cells. This can also be used to remove something more specific, such as a student's favorite social media platform that no longer exists or is deemed no longer relevant (ie: Tumblr, MySpace, etc.)
-
Grouping of row and label columns in order to combine similar field values. This can be used in cases where there are multiple spellings of the same answer (ie: Instagram, instagram, or insta to be grouped as one Category titled: "Instagram"
-
PivotCharts used to visualize filtered pivot datasets and to look for correlative data fields
-
Slicer used to include buttons that filter tables or charts by a certain field
Link to Excel Files
Digital Marketing Test
Summary
This lab involved using excel to solve a digital marketing search optimization question. The question is set up with background information, which includes a brief description of each of the following: impressions, clicks, orders, company ads, search words, cost per click. The scenario is set up so that I represent a company that is in a paid search term. From there, I was asked to solve a list of questions related to cost, positions and click through rate to ultimately generate a conclusion on the position that would benefit my company.
Skills Learned
-
Understanding of calculations for CPM and profit for Digital Advertising (CPC, CTR, Profit per order, etc.)
-
Ability to generate conclusions on what position to take based on costs and total profit
Link to Excel Files

Google Analytics Dashboard
Summary
The google analytics dashboard lab was essentially a digital scavenger hunt of the Google Analytics report of Google Merchandise Store. To complete the scavenger hunt, I was required to answer over 20 questions on the digital marketing and optimization of the site. I used both UA Analytics and GA4 Analytics to complete the test.
Skills Learned
-
Ability to locate various values associated with the Google Merchandise Store during a select time period
-
Values searched for include total users and demographics, page views, total revenue, average order value, CTR, etc.
-
Demonstrative understanding of the values listed in each Report and Sub-Report

Tableau Final Project: Fires in CA
Summary
For the final project for this class, I completed a visualization on climate effects of wildfires in California from 2013 to 2019. Using two datasets downloaded from CA.gov and the UCIPM State Wide Integrated Pest Management Program, I created a visually interesting data story on the link between weather and fires. I also used both Tableau Prep Builder and Tableau Desktop to clean, merge, and plot the two data sets.
Applied Skills
-
Clean step used to remove irrelevant or unnecessary data fields (such as fire agency or unit ID) for both data sets
-
Join step used to join the two data sets based on the "Date" value
-
Created an output of the Tableau Prep Joined Data Set, which I then used to create plots in Tableau Desktop
-
Built a total of six plots comparing various data points on weather patterns in San Luis Obispo to fires across the state
-
Designed three dashboards that each touched on a different concept (overall weather patterns and fires, location of fires, and temperature as a factor for fire expansion)
-
Ensured plots, titles, and paragraphs adhered to a specific brand guideline and theme
-
Created a three part story that facilitated an overall narrative
